
代码调试有时候是一种充满挑战的工作,如果有一个趁手的调试工具的话,往往可以做到事半功倍的效果。得益于这些年的快速发展,在 NodeJS 生态中已经有了多种调试工具可以使用。我们今年就来分享几个常用的调试工具。
在 NodeJS 的代码调试中,通常又两大类调试方法,一种是打印日志,另一种是直接调试代码。我们现在来分别说明。
日志
日志可以帮助我们记录在程序运行过程中的一些状态和错误信息。通过日志,我们可以快速的找到出问题的代码。比如借助于异常日志,我们可以快速的定位到具体的代码行。
debug 模块
debugopen in new window 是很多 NodeJS 包和框架使用的日志工具。这个包的优点是可以通过环境变量的形式细粒度的控制打印哪些日志。
比如在下面的代码中,假设我们先发送了一些请求,然后又接受到了响应数据。
// index.js
const debugHttpIncoming = require('debug')('http:incoming')
const debugHttpOutgoing = require('debug')('http:outgoing')

let outgoingRequest = {
  url: 'https://google.com'
}

// sending some request
debugHttpOutgoing('sending request to %s', outgoingRequest.url)

let incomingRequest = {
  body: '{"status": "ok"}'
}

// serving some request
debugHttpOutgoing('got JSON body %s', incomingRequest.body)
2
3
4
5
6
7
8
9
10
11
12
13
14
15
16
17
当我们通过如下方式启动程序的时候:
DEBUG=http:incoming,http:outgoing node index.js
日志展示如下:
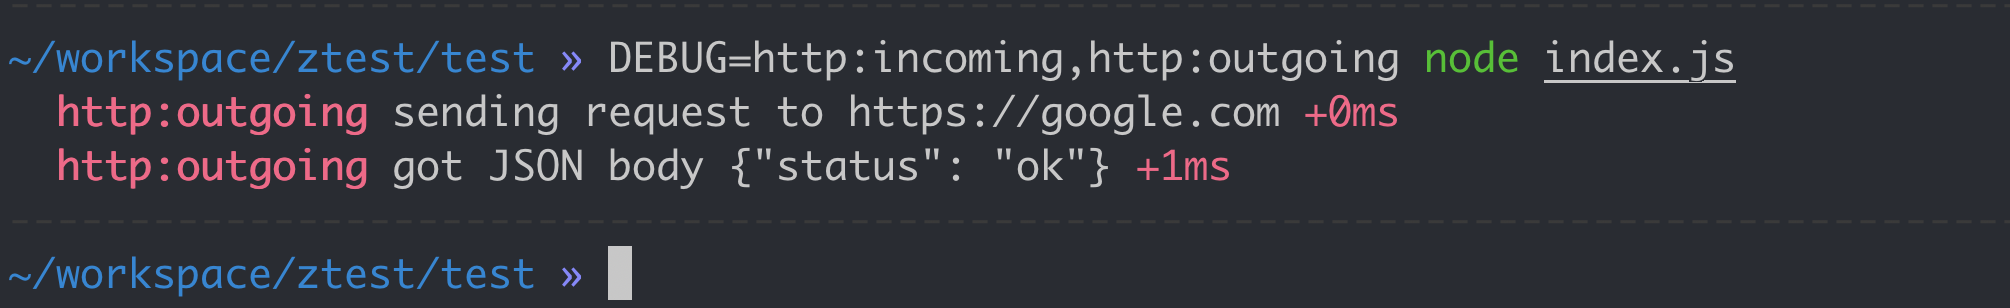
同时,debug 模块还支持 * 通配符,我们可以通过 DEBUG=http:* node index.js 获得上面相同的日志输出。
记录日志到文件
通常,我们需要将应用运行的日志做持久化处理,最简单的方式就是记录到文件。
pinoopen in new window 是一个高性能的日志模块,与 bunyanopen in new window 类似,但是性能更好。
以下是几种日志模块的性能数据对比:
benchWinston*10000:     2226.117ms
benchBunyan*10000:      1355.229ms
benchDebug*10000:       445.291ms
benchLogLevel*10000:    322.181ms
benchBole*10000:        291.727ms
benchPino*10000:        269.109ms
benchPinoExtreme*10000: 102.239ms
2
3
4
5
6
7
pino 使用非常简单:
const pino = require('pino')()

pino.info('hello pino')
pino.info('the answer is %d', 42)
pino.error(new Error('an error'))
2
3
4
5
上面的代码,日志输出如下:
{"level":30,"time":1632626946507,"pid":77749,"hostname":"everfind-MacBook-Pro.local","msg":"hello pino"}
{"level":30,"time":1632626946508,"pid":77749,"hostname":"everfind-MacBook-Pro.local","msg":"the answer is 42"}
{"level":50,"time":1632626946508,"pid":77749,"hostname":"everfind-MacBook-Pro.local","stack":"Error: an error\n    at Object.<anonymous> (/Users/everfind/workspace/ztest/test/pino.js:5:12)\n    at Module._compile (internal/modules/cjs/loader.js:1072:14)\n    at Object.Module._extensions..js (internal/modules/cjs/loader.js:1101:10)\n    at Module.load (internal/modules/cjs/loader.js:937:32)\n    at Function.Module._load (internal/modules/cjs/loader.js:778:12)\n    at Function.executeUserEntryPoint [as runMain] (internal/modules/run_main.js:76:12)\n    at internal/main/run_main_module.js:17:47","type":"Error","msg":"an error"}
2
3
调试
NodeJS 内置调试模块
NodeJS 提供了内置的调试模块。使用起来非常简单直接,缺点是没有 UI 页面,纯命令行操作。
$ node debug index.js
我们通过 debugger 语句来设置断点。
const express = require('express');
const app = express();

app.get('/', (req, res) => {
  debugger;
  res.send('ok');
});

app.listen(3000);
2
3
4
5
6
7
8
9
内置的调试模块支持如下命令:
- cont 或 c –- 继续执行
- next 或 n –- 往下一步
- step 或 s –- 进入函数
- out 或 o –- 退出函数
- repl –- 刷新上下文信息
V8 Inspector
我们还可以通过 V8 inspector,使用 Chrome 的 DevTools 来调试 NodeJS 代码。
$ node --inspect index.js
上面这条命令,通过 --inspect 参数告诉 NodeJS 启用 V8 Inspector。之后我们在 Chrome 中输入 chrome://inspect/,然后找到我们要调试的那个文件,就可以使用 Chrome DevTools 调试代码了。
有时候,我们需要在代码的入口处开始调试,则可以通过 --inspect-brk 来在起始地点开始调试。
$ node --inspect-brk index.js
VSCode
最后我们介绍如何在 VSCode 中调试代码,这也是最高频使用的。
通常我们可以直接通过菜单启动调试,就像上面的演示效果那样。
如果我们需要一些高级设置,VSCode 允许我们配置一个 .vscode/launch.json 文件,来告诉 VSCode 如何启动调试器。
默认的配置项如下:
{
    "version": "0.2.0",
    "configurations": [
        {
            "type": "node",
            "request": "launch",
            "name": "Launch Program",
            "program": "${workspaceRoot}/index.js"
        },
        {
            "type": "node",
            "request": "attach",
            "name": "Attach to Port",
            "address": "localhost",
            "port": 5858
        }
    ]
}
2
3
4
5
6
7
8
9
10
11
12
13
14
15
16
17
18
关于每个配置项的作用和具体用法,可以在 VSCode 的文档open in new window中查询。
另外,如果我们在 VSCode 的内置命令行通过 node --inspect 启动程序的话,会自动激活 VSCode 的调试功能。
 关注微信公众号,获取最新推送~
 加微信,深入交流~